Like every human being, I have a hard time visualizing Lorentz boosts. (Lorentz boosts being the change in velocity that respects special relativity.
I’m considering doing some sort of animations that will show how different events would look depending on your boosted velocity.
But, before that I wrote a little script to try to gain some more intuition behind the boosts:
import numpy as np
import matplotlib.pyplot as plot

events = [np.array([a]) for a in [(1, 2), (2, 1.5), (3, 3), (1, 4)]]


def generate_boost(velocity):
    gamma = 1 / np.sqrt(1 - velocity * velocity)
    return np.matrix([[gamma, -velocity * gamma], [-velocity * gamma, gamma]])


plot.scatter([a.item(0) for a in events], [a.item(1) for a in events], label="before boost")
for v in [0.1, 0.2, 0.3, 0.4, 0.5, 0.6, 0.7, 0.8, 0.9]:
    boost = generate_boost(v)
    plot.scatter(
        [(boost * a.transpose()).item(0) for a in events],
        [(boost * a.transpose()).item(1) for a in events],
        label=f"after boost v={v}c",
    )
plot.title(f"Boost of points {[a[0].tolist() for a in events]}")
plot.xlim([-5, 5])
plot.ylim([-5, 5])
plot.grid(True)
plot.xlabel("x (lightseconds)")
plot.ylabel("t (seconds)")
plot.legend()
plot.show()
plot.pause()
Which produces the following plot:
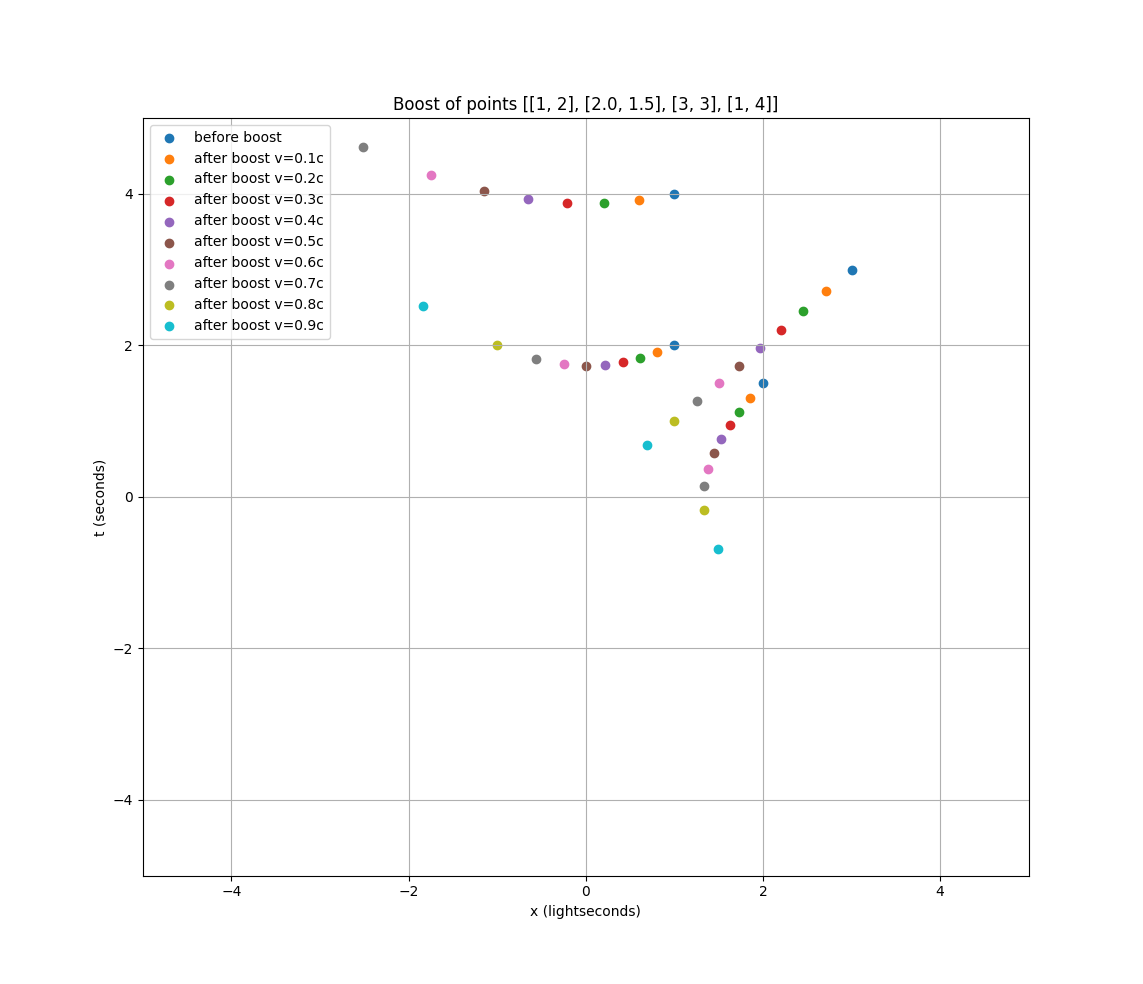
An example point that really shows the weirdness is the point that starts at (1, 2), and when boosted by v=(.5c), it’s at (0, 1.8). Classically if you were boosted by v=.5c, you’d expect the resulting event to take place at (0, 2), but here the event happens even sooner.
Future
I’m imagining a gif of a set of timelines that show when and where you’d see the event depending on velocity, I think it could even be 2D plots for both X-Y and maybe even a set of points.
We’ll see what looks good.